Running Tests
Test definitions describe the environment and workloads you want to run on your cluster, including what versions of Cassandra to test, the configuration, and the stress tests or scripts to run.
Test definitons can either be defined by hand, to be run on the command line, or they can be setup and scheduled in the web interface. This chapter will describe both scenarios.
Running tests with cstar_perf_stress
The setup of cstar_perf.tool installs a command line utility called cstar_perf_stress (stress_compare.py) which is the main tool to run tests. This tool takes a JSON file as input, here’s a sample:
{
 "revisions":[
    {"revision":"apache/cassandra-2.1"},
    {"revision":"apache/cassandra-2.1", "memtable_allocation_type":"offheap_objects"}
 ],
 "title":"Test offheap memtables",
 "log":"stats.cassandra-2.1.offheap_memtables.json",
 "operations": [
    {"type":"stress","command":"write n=65000000 -rate threads=40 -mode cql3 native prepared"},
    {"type":"stress","command":"read n=65000000 -rate threads=40 -mode cql3 native prepared"},
    {"type":"stress","command":"read n=65000000 -rate threads=40 -mode cql3 native prepared"}]
}
This is a hypothetical test for comparing the difference in
performance of two different memtable allocation types in Cassandra
2.1. The first test is just using Cassandra’s default configuration,
while the second introduces the memtable_allocation_type:
offheap_objects setting. Both tests will run the same three stress
commands listed.
You run this scenario on the command line by specifying the JSON file:
cstar_perf_stress cassandra-2.1.offheap_memtables.json
If DSE support is available, you can compare dse products as well. Here’s a sample comparing cassandra-2.1 and DSE 4.6.0:
{
"revisions":[
{"product": "dse", "revision":"4.6.0"},
{"product": "cassandra", "revision":"apache/cassandra-2.1"}
],
"title":"Test DSE 4.6.0 ans Cassandra 2.1",
"log":"stats.dse-4.6.0.cassandra-2.1.json",
"operations": [
{"type":"stress","command":"write n=65000000 -rate threads=40 -mode cql3 native prepared"},
{"type":"stress","command":"read n=65000000 -rate threads=40 -mode cql3 native prepared"},
{"type":"stress","command":"read n=65000000 -rate threads=40 -mode cql3 native prepared"}]
}
Log
The path where to save the test results
Title
A title to describe the test
Revisions
This is a list of every version of Cassandra you want to run in your test as well as any configuration parameters for it.
Parameters:
- revision - the git refspec to version of Cassandra you want to test.
- any other cassandra.yaml setting. In our example above we are setting the memtable_allocation_type on the second revision, whereas the first revision sets no parameters so it uses the default setting.
Operations
Operations is the list of stress tests, commands, or other scripts you want to run on each revision specified.
The parameters vary depending on the type of operation:
type=’stress’
This runs a cassandra-stress workload against the cluster.
- command - the parameters to pass to cassandra-stress
- wait_for_compaction - boolean value specifying whether to wait for
compactions to finish at the end of the opration, defaults to
true.
Example:
{"type":"stress","command":"read n=65000000 -rate threads=40 -mode cql3 native prepared"}
type=’nodetool’
Run a nodetool command
- nodes - the list of nodes to run the command on. If not specified, it will be run on all nodes.
- command - the command to run
Example:
{"type":"nodetool", "command":"setcompactionthroughput 0"}
type=’cqlsh’
This runs a predefined CQL script
- node - the node to run the script on
- script - the script to run
Example:
{"type":"cqlsh", "node":"cnode1", "script":"use my_ks; DELETE from users WHERE user_id='bill';"
type=’bash’
This runs a bash script
- nodes - the list of nodes to run the command on. If not specified, it will be run on all nodes.
- script - the script to run
Example:
{"type":"bash", "script":"rm /path/to/some/file\nrm /path/to/some/other/file"}
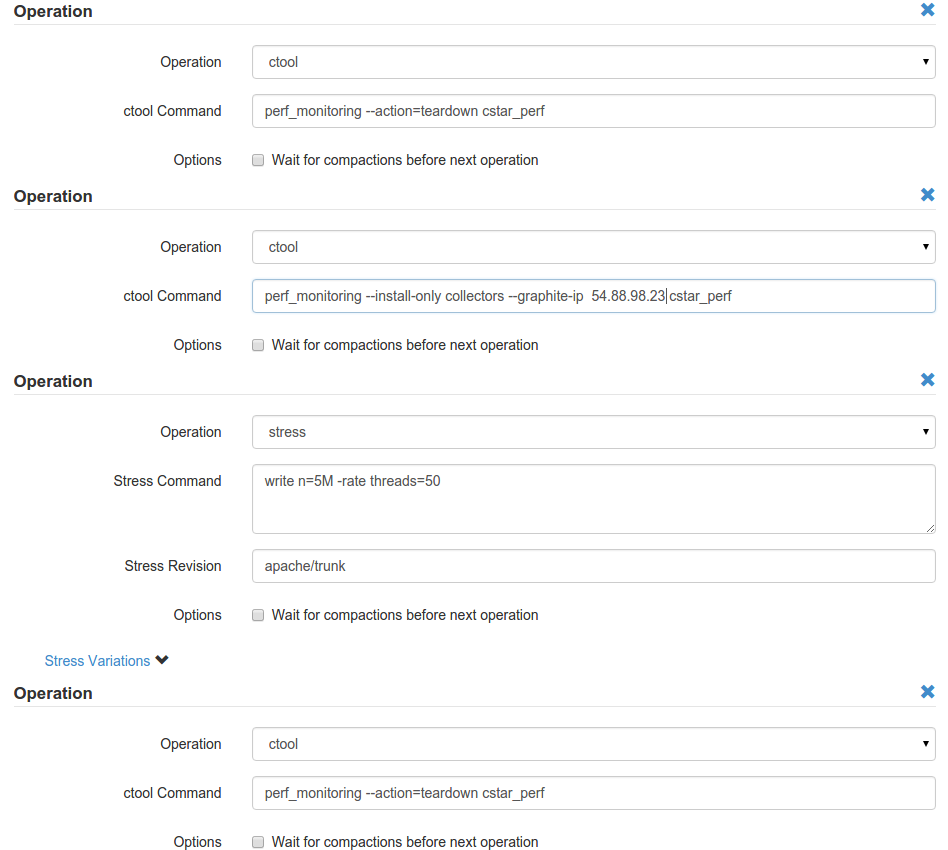
Running tests from the web frontend
Collect metrics using Ctool perf_monitoring
Using the ctool command, you can collect the test metrics with ‘ctool perf_monitoring’.
First, you need to setup a graphite/grafana ec2 instance. cstar_perf will push its metrics data to this server:
ctool launch -p trusty cstar_perf_monitoring 1
Log in the server and create the data directory:
sudo mkdir /mnt/cass_data_disks/
sudo chown automaton /mnt/cass_data_disks/
Install the perf_monitoring requirements:
ctool perf_monitoring --install-only graphite
Note the public ip address of the graphite node and use the following template for your job definition. Don’t forget to replace the ip address: